
In today’s dynamic business landscape, measuring marketing success is paramount. Key Performance Indicators (KPIs) provide quantifiable metrics to gauge the effectiveness of marketing campaigns and overall strategies. Understanding and tracking the right KPIs is essential for optimizing resource allocation, improving return on investment (ROI), and achieving desired business outcomes. This article will explore the top 10 KPIs that every marketer should monitor to measure marketing success and drive continuous improvement. From website traffic and conversion rates to customer lifetime value (CLTV) and brand awareness, these metrics offer valuable insights into campaign performance and overall marketing effectiveness. By focusing on these critical KPIs, businesses can make data-driven decisions, refine their marketing approaches, and achieve sustainable growth.
Whether you’re focused on digital marketing, social media marketing, or traditional marketing channels, choosing the right KPIs is crucial for evaluating success. This article will delve into each of the 10 essential KPIs, providing a comprehensive understanding of their importance and how to effectively track and analyze them. By mastering these key metrics, marketers can gain a clear picture of their marketing performance, identify areas for improvement, and ultimately drive better results. Learn how to leverage these KPIs to demonstrate the value of your marketing efforts and achieve your business objectives.
Customer Acquisition Cost (CAC)
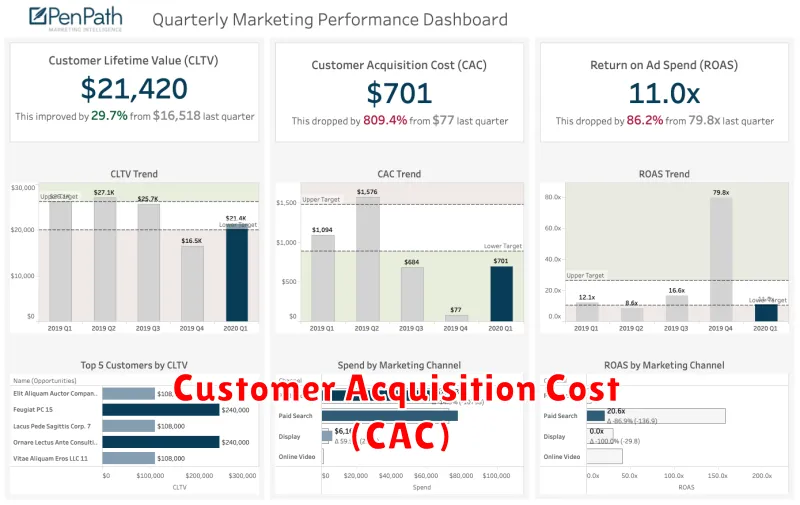
Customer Acquisition Cost (CAC) refers to the total cost a business incurs to acquire a new customer. Understanding your CAC is crucial for determining the profitability and efficiency of your marketing campaigns.
A high CAC can indicate issues with your marketing strategy, while a low CAC suggests efficiency. Tracking CAC allows businesses to optimize their spending and improve their return on investment (ROI).
Calculating CAC involves dividing the total marketing and sales costs associated with acquiring new customers over a specific period by the number of customers acquired during that same period.
Formula: CAC = Total Marketing & Sales Costs / Number of New Customers Acquired
For example, if a company spends $5,000 on marketing and sales in a month and acquires 100 new customers, their CAC is $50.
Benchmarking: Comparing your CAC to industry averages and competitors can provide valuable insights into your performance and areas for improvement.
Customer Lifetime Value (CLV)
Customer Lifetime Value (CLV) represents the total revenue a business can reasonably expect from a single customer throughout their entire relationship. Understanding CLV is crucial for allocating marketing resources effectively.
By calculating CLV, businesses can make informed decisions about sales, marketing, product development, and customer support. A higher CLV indicates stronger customer relationships and a more sustainable business model.
Several factors influence CLV including customer acquisition cost, customer retention rate, and average purchase value. Focusing on strategies that increase customer retention and encourage repeat purchases can significantly impact CLV.
Example CLV Calculation:
| Average Purchase Value | Average Purchase Frequency Rate | Average Customer Lifespan | CLV |
|---|---|---|---|
| $50 | 4 times/year | 3 years | $600 |
($50 x 4 x 3 = $600)
Conversion Rate
Conversion rate measures the percentage of visitors or leads who complete a desired action. This action could be anything from making a purchase to signing up for a newsletter or downloading a resource. It’s a critical indicator of marketing campaign effectiveness and overall website performance.
A high conversion rate suggests that your marketing efforts are successfully driving desired user behavior. Conversely, a low conversion rate indicates areas needing improvement, such as website usability, messaging clarity, or targeting.
Calculating the conversion rate is straightforward: divide the number of conversions by the total number of visitors or leads and multiply by 100 to express it as a percentage.
For example:
- 1000 website visitors
- 50 completed purchases
- Conversion rate: (50 / 1000) * 100 = 5%
By tracking and analyzing conversion rates, businesses can identify strong and weak points in their marketing strategies and make data-driven decisions to optimize campaigns for better results.
Click-Through Rate (CTR)
Click-Through Rate (CTR) measures the percentage of people who see your ad (impressions) and then click on it. It’s a crucial metric for evaluating the effectiveness of your ad copy, targeting, and overall campaign performance.
A high CTR indicates that your ads are resonating with your target audience and effectively driving traffic to your website or landing page. A low CTR, conversely, suggests a need for optimization. This could involve refining your ad copy, adjusting targeting parameters, or testing different ad formats.
Calculating CTR is straightforward: divide the number of clicks by the number of impressions and multiply by 100 to express it as a percentage.
For example:
- Impressions: 10,000
- Clicks: 200
- CTR: (200/10,000) * 100 = 2%
Benchmarking CTR can be helpful, but it’s important to consider industry averages and the specifics of your campaigns. Factors like ad placement and industry can significantly influence CTR.
Bounce Rate
Bounce rate represents the percentage of visitors who enter a website and then leave (“bounce”) rather than continuing to view other pages within the same site. A high bounce rate can indicate several issues, such as poor user experience, irrelevant content, or technical problems. Conversely, a low bounce rate suggests visitors are engaging with the content and finding it valuable.
Tracking bounce rate is crucial for understanding website effectiveness. It helps identify areas needing improvement, whether it’s site design, content relevance, or targeting strategies. Analyzing bounce rate alongside other KPIs provides a more comprehensive view of marketing performance.
Calculating Bounce Rate:
Bounce Rate = (Single-page sessions / Total sessions) * 100
For example, if a website has 1,000 total sessions and 200 of those sessions are single-page visits, the bounce rate would be (200/1000)*100 = 20%.
Return on Ad Spend (ROAS)
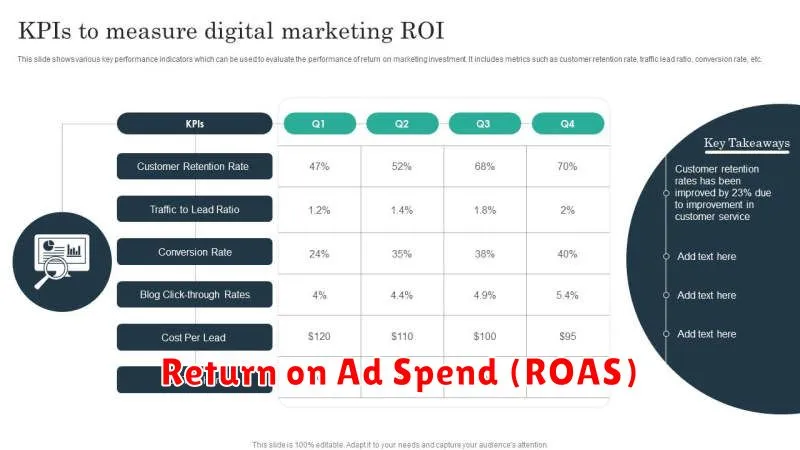
Return on Ad Spend (ROAS) measures the revenue generated for every dollar spent on advertising. It’s a crucial KPI for evaluating the effectiveness and profitability of your advertising campaigns.
Calculating ROAS is straightforward: divide the total revenue attributed to your ads by the total ad spend. For example, if you spend $1,000 on ads and generate $4,000 in revenue, your ROAS is 4:1, or 400%.
A higher ROAS indicates a more efficient and profitable advertising campaign. Monitoring ROAS helps optimize campaigns, allocate budget effectively, and maximize returns. A low ROAS suggests the need to re-evaluate your targeting, ad creatives, or overall campaign strategy.
Engagement Rate
Engagement rate measures how actively your audience interacts with your content. It’s a crucial KPI for understanding the effectiveness of your marketing campaigns in fostering genuine connection and interest.
Calculating engagement rate varies depending on the platform and content type. Common metrics used in calculating engagement include likes, comments, shares, saves, and clicks. A higher engagement rate typically indicates resonating content and a more involved audience.
Example Formula (Social Media):
(Total Engagements / Total Reach) * 100%
Tracking engagement rate allows you to understand what type of content performs best, optimize future campaigns, and ultimately improve your overall marketing ROI.
Lead-to-Customer Ratio
The Lead-to-Customer Ratio is a crucial KPI that reveals the effectiveness of your marketing efforts in converting leads into paying customers. It provides valuable insights into the efficiency of your sales funnel and helps identify areas for improvement.
This ratio is calculated by dividing the total number of new customers acquired during a specific period by the total number of leads generated within the same timeframe. A higher ratio indicates a more effective lead generation and nurturing process, while a lower ratio suggests potential weaknesses that need to be addressed.
Analyzing this metric helps businesses understand which marketing channels and campaigns are producing the most qualified leads, ultimately driving revenue growth. By focusing on improving this ratio, organizations can optimize their marketing spend and achieve a higher return on investment (ROI).
Organic Traffic Growth
Organic traffic growth is a crucial key performance indicator (KPI) for measuring the effectiveness of your long-term marketing strategies. It refers to the increase in visitors coming to your website from unpaid search engine results. Tracking this KPI provides valuable insights into the success of your search engine optimization (SEO) efforts and content marketing strategy.
A consistent upward trend in organic traffic signifies that your website is gaining visibility and attracting a larger audience genuinely interested in your offerings. This translates to increased brand awareness, lead generation potential, and ultimately, higher conversion rates.
Several factors contribute to organic traffic growth, including:
- High-quality, relevant content
- Effective keyword targeting
- Technical SEO optimization
- Building high-quality backlinks
Measuring organic traffic growth involves analyzing data from website analytics platforms like Google Analytics. Focus on metrics such as:
- Number of organic sessions
- Average session duration
- Bounce rate
- Organic conversions
Email Open Rate
Email open rate measures the percentage of recipients who open a given email. It’s a crucial KPI for email marketing, providing insights into the effectiveness of your subject lines and the overall engagement of your audience.
A low open rate may signal issues with your subject lines, sender reputation, or the relevance of your content to your target audience. Conversely, a high open rate suggests that your emails are capturing attention and generating interest.
Calculating Email Open Rate:
Open Rate = (Number of Emails Opened / Number of Emails Delivered) * 100
While open rates can be influenced by various factors, including industry and email list quality, tracking this metric helps identify areas for improvement in your email marketing strategy. Consistently monitoring open rates allows you to optimize subject lines, segment your audience more effectively, and ultimately improve overall email performance.