
In today’s competitive market, leveraging data is no longer a luxury but a necessity for successful marketing campaigns. Understanding how to collect, analyze, and interpret data can significantly enhance the effectiveness of your marketing strategies. This article will delve into the essential steps and techniques involved in using data to improve your marketing campaigns, ultimately leading to higher conversion rates, increased ROI, and a stronger brand presence.
By harnessing the power of data analysis, marketers can gain invaluable insights into customer behavior, preferences, and market trends. This knowledge empowers businesses to create highly targeted and personalized marketing campaigns that resonate with their audience. From identifying the most effective marketing channels to optimizing ad spend and crafting compelling content, data serves as a crucial foundation for making informed decisions and achieving marketing success. This guide will equip you with the knowledge to transform your marketing efforts through data-driven strategies.
Setting Clear Marketing KPIs
Key Performance Indicators (KPIs) are crucial for measuring the success of your marketing campaigns. Clearly defined KPIs provide a quantifiable way to track progress, identify areas for improvement, and demonstrate the return on investment (ROI) of your marketing efforts.
Choosing the right KPIs depends on your specific marketing objectives. For example, if your goal is to increase brand awareness, relevant KPIs might include reach, impressions, and social media engagement. If your goal is to drive sales, you might focus on KPIs such as conversion rate, cost per acquisition, and average order value.
It’s important to set SMART KPIs: Specific, Measurable, Achievable, Relevant, and Time-bound. This framework ensures your KPIs are well-defined and contribute to meaningful insights. For instance, instead of a vague KPI like “increase website traffic,” a SMART KPI would be “increase website traffic by 15% in the next quarter.”
Collecting Data from Multiple Channels
Effective marketing campaigns rely on insightful data gathered from various sources. Collecting data from multiple channels provides a holistic view of customer behavior and campaign performance.
Key channels to consider include:
- Website Analytics: Track website traffic, user behavior, and conversions to understand how users interact with your online presence.
- Social Media Analytics: Monitor engagement, reach, and demographics across different social platforms to identify trends and audience preferences.
- Email Marketing Metrics: Analyze open rates, click-through rates, and conversions to gauge the effectiveness of email campaigns.
- CRM Data: Leverage customer relationship management systems to gather data on customer interactions, purchase history, and demographics.
- Paid Advertising Data: Track impressions, clicks, and conversions from paid campaigns to optimize ad spend and targeting.
Integrating data from these diverse channels offers a comprehensive understanding of customer journeys, allowing for more targeted and effective marketing strategies.
Using Data to Understand Customer Behavior
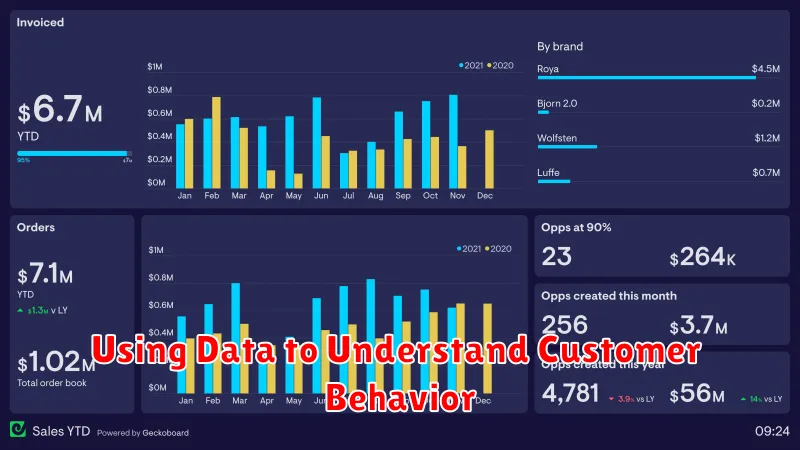
Data analysis plays a crucial role in understanding customer behavior. By examining various data points, businesses can gain valuable insights into customer preferences, needs, and pain points.
Key data points to consider include demographics, purchase history, website activity, and social media engagement. Analyzing these data points can reveal patterns and trends in customer behavior.
For example, analyzing website activity can identify popular products or services, peak traffic times, and common customer journeys. This information can be used to optimize website design, personalize content, and improve the overall user experience.
Social media engagement data provides insights into customer sentiment, brand perception, and trending topics. This information can be used to tailor social media strategies, engage with customers more effectively, and address customer concerns.
By leveraging data-driven insights, businesses can gain a deeper understanding of their target audience, personalize marketing messages, and ultimately, improve campaign performance.
Running Data-Driven A/B Tests
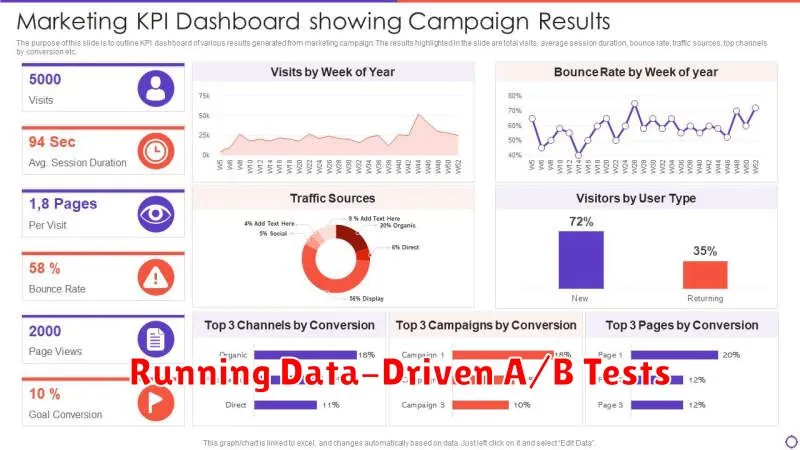
A/B testing is a powerful tool for optimizing marketing campaigns. It involves comparing two versions of a campaign element, such as a headline, call to action, or email subject line, to determine which performs better.
Data-driven A/B testing relies on statistical analysis to make informed decisions. Start by defining a clear objective, such as increasing click-through rates or conversion rates. Then, create two versions (A and B) of the element you want to test.
Randomly assign users to either version A or version B. Track the performance of each version, collecting data on the chosen metric. Use statistical significance calculations to determine if the observed difference in performance between the two versions is likely due to the change made, and not random chance.
Finally, implement the winning version based on the results of your test. Continuously iterate and test different elements to consistently improve your marketing campaign performance.
Visualizing Metrics for Better Reporting
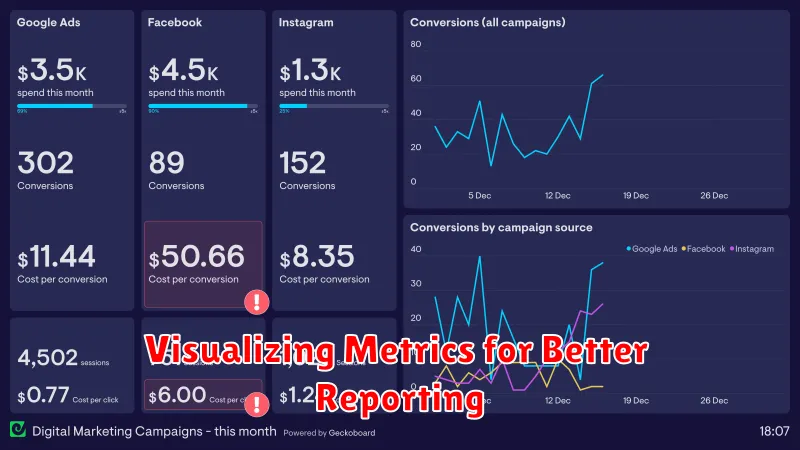
Data visualization transforms raw marketing metrics into comprehensible insights. Instead of sifting through spreadsheets, visualizing data allows you to quickly identify trends, patterns, and outliers.
Key Performance Indicators (KPIs) benefit significantly from visualization. Charts and graphs can effectively communicate progress towards goals, highlighting areas of success and those needing improvement. For example, a line graph can showcase the trend of website traffic over time, while a bar chart can compare conversion rates across different marketing channels.
Choosing the right visualization method is crucial. Consider the type of data and the message you want to convey. Some common and effective visualizations for marketing reports include:
- Line charts: Track trends over time.
- Bar charts: Compare performance across categories.
- Pie charts: Show the proportion of a whole.
- Scatter plots: Identify correlations between variables.
Visualizing data not only simplifies reporting but also facilitates data-driven decision-making. Clear visuals make it easier to identify areas for optimization and allocate resources effectively.
Turning Insights Into Action
Analyzing data is only the first step. The true value lies in turning those insights into actionable strategies that improve your marketing campaigns. This requires a strategic approach to implementation and ongoing monitoring.
Prioritize your insights based on potential impact and feasibility. Focus on the changes that are most likely to deliver significant results with manageable effort. For example, if data reveals a particular demographic segment responds well to a specific type of content, concentrate your efforts on creating more similar content targeted at that segment.
Develop a clear action plan. Outline the specific steps needed to implement the changes based on your insights. This may involve adjusting targeting parameters, revising messaging, reallocating budget, or exploring new channels. Clearly define roles and responsibilities to ensure efficient execution.
Monitor the results of your changes. Continuously track key performance indicators (KPIs) to measure the effectiveness of your actions. This allows you to make further adjustments and optimize your campaigns over time based on real-world data.
Adjusting Strategy Based on Analytics
Data analysis is crucial for optimizing marketing campaigns. Analyzing key metrics allows you to understand what’s working and what’s not, enabling data-driven adjustments to your strategy.
Key Performance Indicators (KPIs) should be constantly monitored. These metrics, specific to your campaign goals, could include conversion rates, click-through rates, or customer acquisition cost. Significant deviations from expected results signal a need for adjustment.
Analyzing campaign performance involves identifying trends and patterns. For example, if your conversion rate is declining, examine the data to pinpoint the source of the issue. Is it a specific landing page, demographic, or time of day?
Based on your analysis, implement strategic adjustments. This might involve revisiting your target audience, tweaking ad copy, or reallocating budget to higher-performing channels. Continuous monitoring and adjustment are key to maximizing campaign effectiveness.