
In today’s digitally driven world, social media has become an indispensable tool for businesses of all sizes. Understanding and effectively leveraging social media requires more than just posting content; it necessitates a data-driven approach. Tracking the right social media metrics is crucial for measuring the success of your social media strategy, understanding audience engagement, and ultimately achieving your business objectives. This article will outline the top 10 social media metrics you should be tracking to optimize your social media presence and maximize your return on investment.
Whether you’re focused on brand awareness, lead generation, or driving sales, monitoring key social media metrics provides invaluable insights into your audience’s behavior and your content’s performance. From engagement rate and reach to conversion rate and customer satisfaction, understanding these metrics empowers you to make informed decisions, refine your strategy, and achieve tangible results. By delving into the following 10 essential social media metrics, you’ll gain a comprehensive understanding of how to effectively measure your social media success and drive meaningful business growth.
Engagement Rate
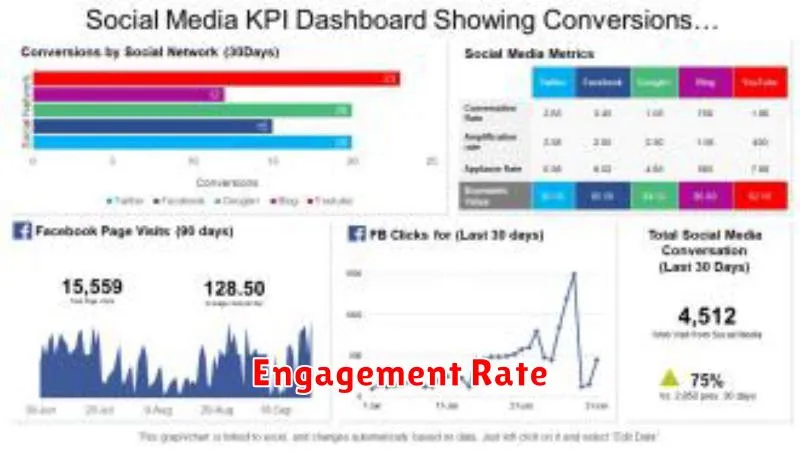
Engagement rate measures how actively your audience interacts with your content. It’s a crucial metric for understanding the effectiveness of your social media strategy. A high engagement rate suggests your content resonates with your followers, while a low rate may indicate a need to reassess your approach.
Several factors contribute to engagement rate, including likes, comments, shares, and saves. The specific formula for calculating engagement rate varies depending on the platform and the specific engagement metrics you choose to prioritize. A common calculation involves dividing the total number of engagements by your reach or impressions, then multiplying by 100 to express it as a percentage.
Tracking engagement rate allows you to identify top-performing content, understand audience preferences, and optimize your posting strategy for maximum impact.
Impressions and Reach
Impressions and reach are two fundamental metrics that provide insights into the visibility of your social media content. While often used interchangeably, they represent distinct aspects of audience engagement.
Reach refers to the unique number of users who have seen your content. It indicates the potential audience size your content has reached. A higher reach suggests your content is being exposed to a wider audience.
Impressions, on the other hand, represent the total number of times your content has been displayed, regardless of whether it was viewed by a unique user. One user can generate multiple impressions if they see your content multiple times. A higher impression count signifies greater overall visibility, but it doesn’t necessarily mean more people are seeing your content.
Tracking both reach and impressions is crucial for understanding how your content is performing. A large discrepancy between reach and impressions can indicate that the same users are seeing your content repeatedly, which can inform your content distribution strategy.
Click-Through Rate (CTR)
Click-Through Rate (CTR) measures how often people click on your social media content after seeing it. It is calculated by dividing the number of clicks by the number of impressions and multiplying by 100 to express it as a percentage. A high CTR generally indicates engaging content that resonates with your audience.
Why is CTR important? It’s a key indicator of the effectiveness of your social media marketing strategies. A high CTR suggests your content is compelling enough to prompt action. It also signifies that you are successfully targeting the right audience with the right message.
How to improve CTR:
- Create compelling ad copy and visuals.
- Use strong calls to action.
- Target the right audience.
- A/B test different ad creatives.
Follower Growth Rate
Follower growth rate is a key metric for understanding the effectiveness of your social media strategy in attracting new followers. It measures the rate at which your follower count is increasing over a specific period.
Calculating this metric involves comparing your current follower count to your previous follower count. The result, expressed as a percentage, shows your growth. A consistently positive growth rate indicates your content and engagement tactics are resonating with your target audience.
Tracking follower growth rate helps identify which strategies contribute most to attracting new followers and which ones need adjustment. For instance, a sudden spike in followers might correlate with a successful campaign. Conversely, a decline might indicate a need to revisit content strategy or posting frequency.
This metric shouldn’t be examined in isolation. While a high growth rate is desirable, it should be viewed in conjunction with other metrics like engagement rate to ensure your growing audience is also actively interacting with your content.
Share of Voice
Share of Voice (SOV) is a vital metric for understanding your brand’s visibility and prominence within the social media landscape. It measures the percentage of conversations related to your industry or specific keywords that mention your brand compared to your competitors.
Tracking SOV provides valuable insights into your brand’s market share and the effectiveness of your social media strategy. A higher SOV generally indicates greater brand awareness and a stronger presence within your target market.
Calculating SOV involves monitoring social media mentions, blog posts, forums, and other online platforms for relevant keywords. You then compare the number of mentions your brand receives against the total number of mentions garnered by all competitors in your industry.
Improving SOV can involve tactics such as:
- Creating engaging and shareable content
- Running targeted social media campaigns
- Engaging with influencers and industry leaders
- Monitoring and responding to brand mentions
Video View Count
Video view count is a fundamental metric for assessing video performance. It quantifies the number of times a video has been viewed. A view is typically counted after a user has watched the video for a certain duration, though this threshold varies across platforms (e.g., a few seconds on platforms like Facebook and Instagram, or 30 seconds on YouTube).
Tracking view count helps you understand the reach of your video content. A higher view count suggests broader audience engagement, while a low count might indicate issues with discoverability, targeting, or content quality.
Be mindful that view count alone doesn’t fully represent the value of your video. Consider alongside other metrics like watch time, engagement, and conversions for a more comprehensive understanding of video performance.
Post Saves and Shares
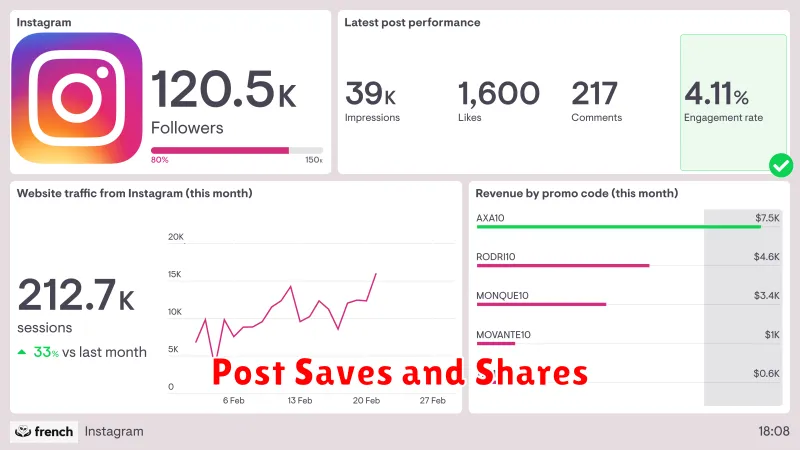
Saves and shares are powerful indicators of content resonance. A save signifies that a user found your content valuable enough to revisit later. This suggests your content provides lasting utility or interest. Tracking saves helps you understand what type of content resonates deeply with your audience and encourages them to keep it for future reference.
Shares, on the other hand, demonstrate the virality and reach of your content. A share indicates that a user found your content compelling enough to distribute it within their own network. Monitoring shares provides insights into the type of content that sparks conversation and expands your brand’s visibility.
Analyzing both metrics together provides a comprehensive understanding of content performance. High saves coupled with low shares might suggest niche appeal, while high shares with low saves could indicate more transient viral content.
Referral Traffic from Social
Referral traffic from social media platforms indicates how effective your social media strategy is at driving visitors to your website. Tracking this metric helps you understand which platforms are most effective at generating leads and conversions.
By analyzing referral traffic, you can identify which social media content resonates most with your target audience and drives them to take the next step, such as exploring your products or services, reading your blog, or making a purchase. This metric provides valuable insights into the return on investment (ROI) of your social media efforts.
You can measure referral traffic using analytics tools like Google Analytics. These platforms provide detailed data on the source of your website traffic, allowing you to pinpoint which social media channels are contributing the most.
Customer Response Time
Customer Response Time (CRT) measures how quickly your team responds to customer inquiries on social media. It’s a vital metric for gauging customer satisfaction and demonstrating your brand’s responsiveness.
A low CRT signifies that your team is actively engaging with customers and addressing their concerns promptly. Conversely, a high CRT may indicate resource constraints or inefficiencies in your social media management process.
Tracking CRT can identify areas for improvement in your workflow. This might involve optimizing staffing schedules, investing in better social media management tools, or implementing chatbots to handle frequently asked questions.
Analyze your CRT alongside customer satisfaction scores to understand the direct impact of response time on customer happiness. This can also help prioritize which channels require the most attention.
Conversion Rate from Social Ads
Conversion rate measures the effectiveness of your social media advertising in driving desired actions. It indicates the percentage of users who click on your ad and then complete a specific action, such as making a purchase, signing up for a newsletter, or filling out a form.
Tracking this metric helps you understand which ad campaigns are truly resonating with your target audience and leading to tangible results. A low conversion rate may suggest issues with your ad copy, targeting, or landing page experience.
Calculating your conversion rate is straightforward:
(Total Conversions / Total Ad Clicks) * 100 = Conversion Rate
For example, if you receive 100 clicks on an ad and 5 users make a purchase, your conversion rate is 5%.
By monitoring and optimizing your conversion rate, you can improve the return on investment (ROI) of your social media advertising efforts.